In October 2015, General Mills introduced a line of Star Wars prizes in some of their cereal boxes.

In statistics, we're all about distributions. That is, models that say how likely something is. You're probably familiar with at least one, the normal distribution (a.k.a. the Gaussian distribution, a.k.a. the bell curve).

One more distribution we need is the geometric distribution. It asks a question similar to the cereal box prize distribution: "how many times do I need to flip a coin before I see heads?" While it may sound like a nitpicky nuance to say this is different from the Bernoulli distribution, it's actually completely different.
If we take one experiment, that is, one sample, from the Bernoulli distribution, we either get heads or tails (a 0 or 1). If we take one experiment from the geometric distribution, we start flipping a coin, stop when we see a head, and report the number of tosses. This can be 1, 2, 3, 4, ... all the way up to infinity. Though it may sound impossible, we can fairly easily compute the probability that we toss the coin once, twice, etc.
Perhaps a longer discussion for another time, but as soon as we can compute those probabilities, we can then compute all sorts of things. For example, we can find the average number of coin tosses we need to see a head. If the probability of a single toss coming up heads is p, then on average, we should expect it to take 1/p times. Intuitively, the higher the chance we have of a single toss being heads, the fewer times we have to toss the coin to see heads (again, on average).
Finally, we're ready for the cereal box prizes.
I just lied. We're going to do a simplified version of the cereal box prize distribution. The full version is more tricky, and I haven't quite figured it out yet. Look for Part II sometime soon.
The simplified version is when there are only 2 prizes. Let's say C-3PO and R2-D2. The probability of getting C-3PO will be p, which makes the probability of getting R2-D2 1-p. If p=0.5, then it's an even chance of each. p=0.6 is 60-40, and p=0.25 is 25-75.
Now, we can actually answer our main question: how many boxes (on average) do I need to buy to reunite the galaxy-saving duo? It turns out that this question is just like the geometric distribution, with a small twist. We buy one box first. If it's C-3PO, then we only care about finding R2-D2. If it's R2-D2, then we only care about finding C-3PO.
We just have two geometric distributions! One based on a success rate p, the other with a success rate 1-p. If you do a bunch of math...
 We arrive at the nice, elegant answer:


Image credits:

Much like the boy who asked, "Mr. Owl, how many licks does it take to get to the Tootsie Roll center of a Tootsie Pop?" I wanted to know:
How many boxes of cereal do I need to buy to get all the prizes?
If you looked at the image, screamed "6!" at your screen, and wondered why there are additional sections to this post, let me clarify: we don't know what prize is inside until we open the box.
It's random.
Now, we're in statistics country.
In statistics, we're all about distributions. That is, models that say how likely something is. You're probably familiar with at least one, the normal distribution (a.k.a. the Gaussian distribution, a.k.a. the bell curve).
If we think about GPA, the normal distribution says (if the average is a C), that C would be in the middle, which is also the most common. A would be far out to the right (which is less common) and B would be in-between. The height of the distribution is an indicator of how likely it is.
Another common distribution (though you may not have thought of it that way) is the Bernoulli distribution. It also goes by another name: the coin flip. But this isn't just any coin flip. It can be an unfair coin, where the probability of heads may not be exactly 1/2. As opposed to the normal distribution which can have any real number as its outcome (just with varying probabilities, concentrated around the middle), the Bernoulli distribution comes out as heads with probability p and tails with probability 1-p. The question it asks is, "how likely is a coin flip to come out heads?" This will be the basis for the cereal box prize distribution.
Now, let's go deeper.
One more distribution we need is the geometric distribution. It asks a question similar to the cereal box prize distribution: "how many times do I need to flip a coin before I see heads?" While it may sound like a nitpicky nuance to say this is different from the Bernoulli distribution, it's actually completely different.
If we take one experiment, that is, one sample, from the Bernoulli distribution, we either get heads or tails (a 0 or 1). If we take one experiment from the geometric distribution, we start flipping a coin, stop when we see a head, and report the number of tosses. This can be 1, 2, 3, 4, ... all the way up to infinity. Though it may sound impossible, we can fairly easily compute the probability that we toss the coin once, twice, etc.
Perhaps a longer discussion for another time, but as soon as we can compute those probabilities, we can then compute all sorts of things. For example, we can find the average number of coin tosses we need to see a head. If the probability of a single toss coming up heads is p, then on average, we should expect it to take 1/p times. Intuitively, the higher the chance we have of a single toss being heads, the fewer times we have to toss the coin to see heads (again, on average).
Finally, we're ready for the cereal box prizes.
I just lied. We're going to do a simplified version of the cereal box prize distribution. The full version is more tricky, and I haven't quite figured it out yet. Look for Part II sometime soon.
The simplified version is when there are only 2 prizes. Let's say C-3PO and R2-D2. The probability of getting C-3PO will be p, which makes the probability of getting R2-D2 1-p. If p=0.5, then it's an even chance of each. p=0.6 is 60-40, and p=0.25 is 25-75.
Now, we can actually answer our main question: how many boxes (on average) do I need to buy to reunite the galaxy-saving duo? It turns out that this question is just like the geometric distribution, with a small twist. We buy one box first. If it's C-3PO, then we only care about finding R2-D2. If it's R2-D2, then we only care about finding C-3PO.
We just have two geometric distributions! One based on a success rate p, the other with a success rate 1-p. If you do a bunch of math...


So the expected number of boxes we need to buy looks like this:

For a 50-50 chance, on average, we'll need to buy 3 cereal boxes. The farther p is from 0.50, the worse it gets. A 17-83 split causes us to buy 6 boxes on average. A 10-90 would be 10 boxes. A 2-98 would be 50 boxes!
And there you have it. The cereal box prize distribution.
Image credits:
- Hunt, Kevin. "These are the droids you're looking for." Taste of General Mills. 2015 October.
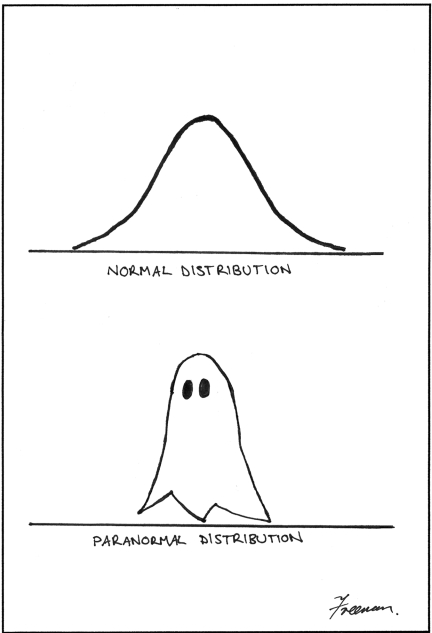
- Freeman, Matthew. “A visual comparison of normal and paranormal distributions.” Journal of Epidemiology and Community Health. 2006 January; 60(1): 6
You are doing really good job. I've bookmarked you for further amazing content.
ReplyDeleteBakery Boxes
Keep it up mates. wedding boxes
nice article about Cereal Boxes
ReplyDelete